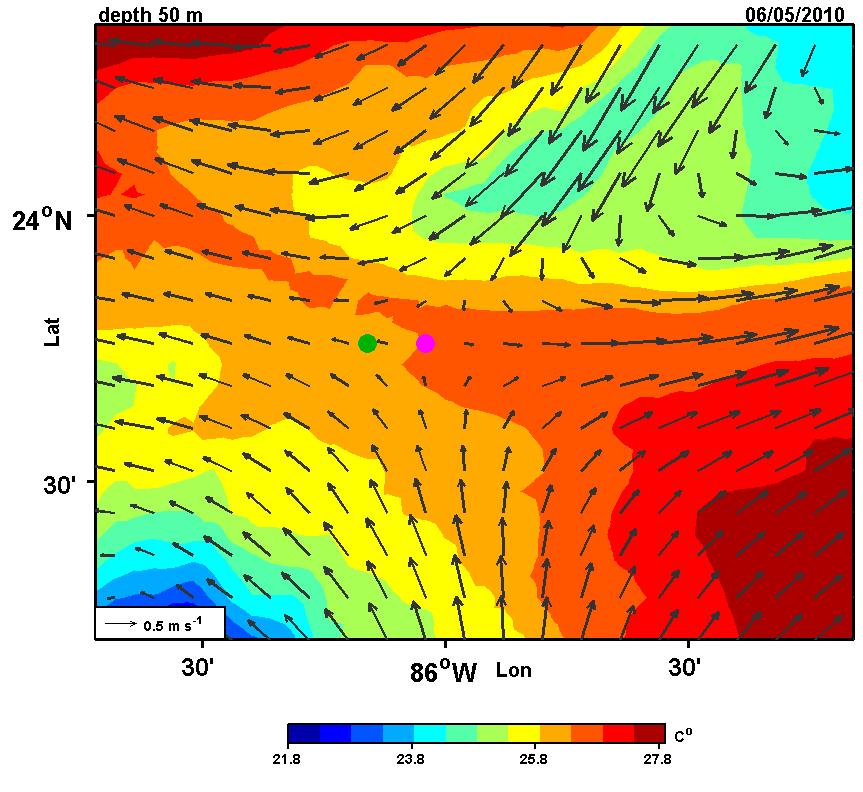
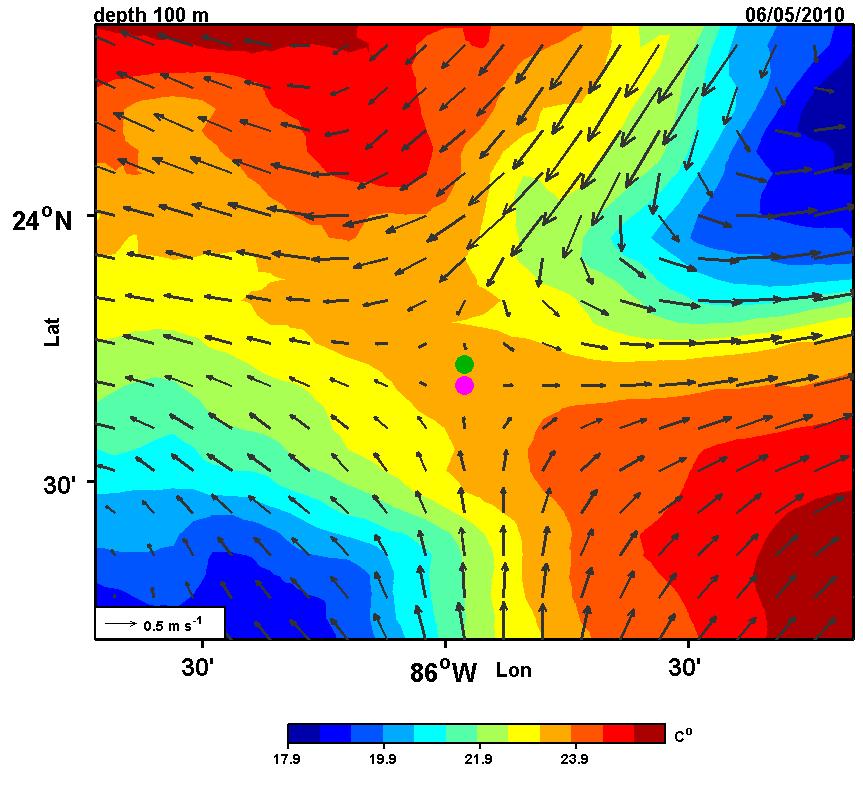
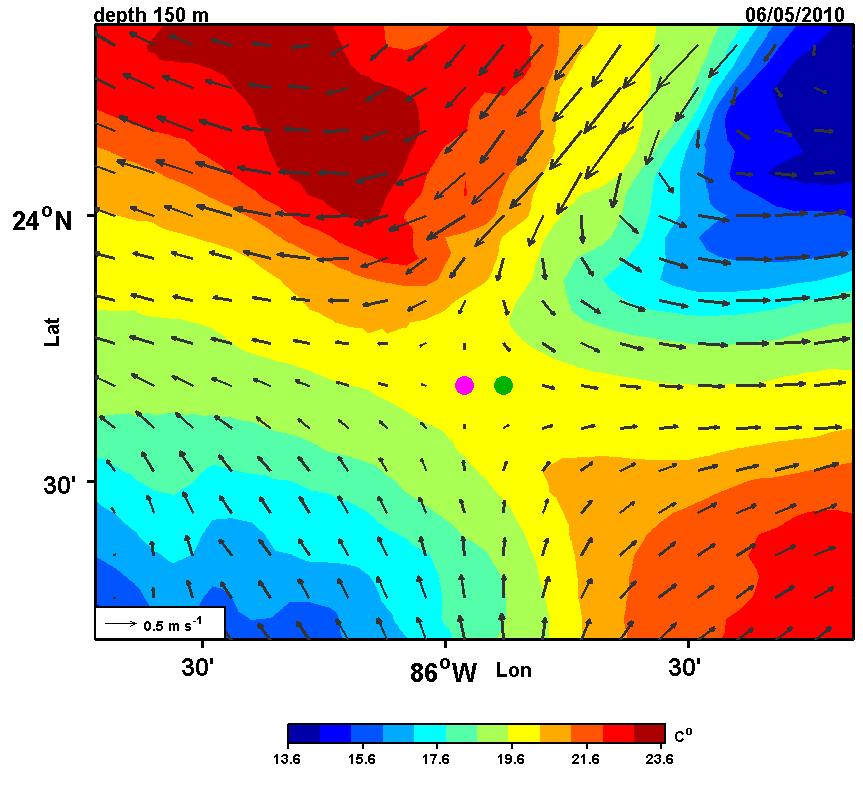
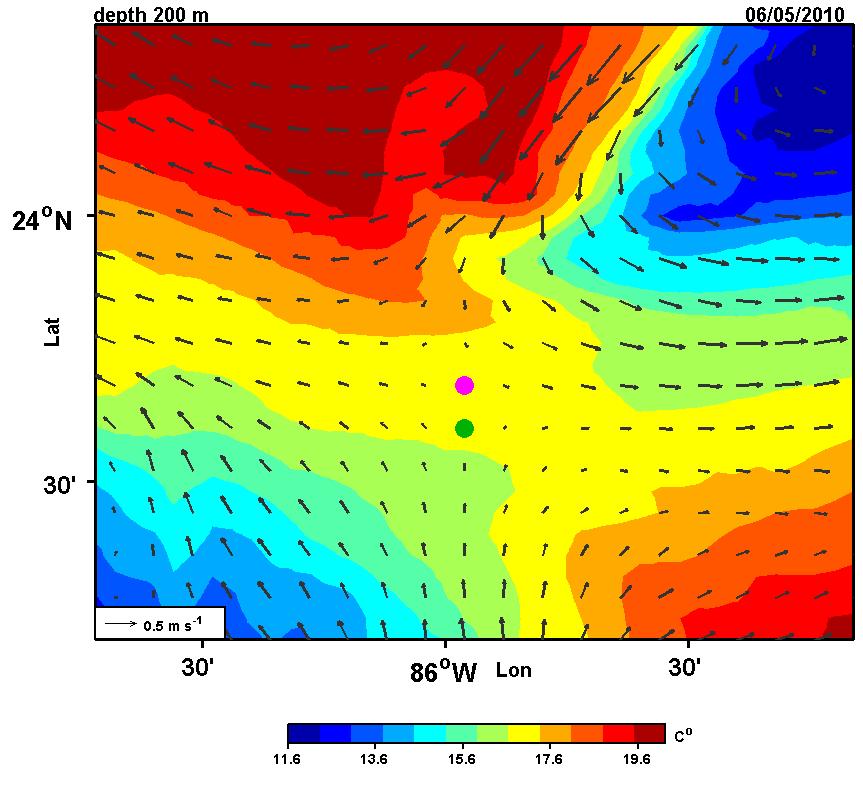
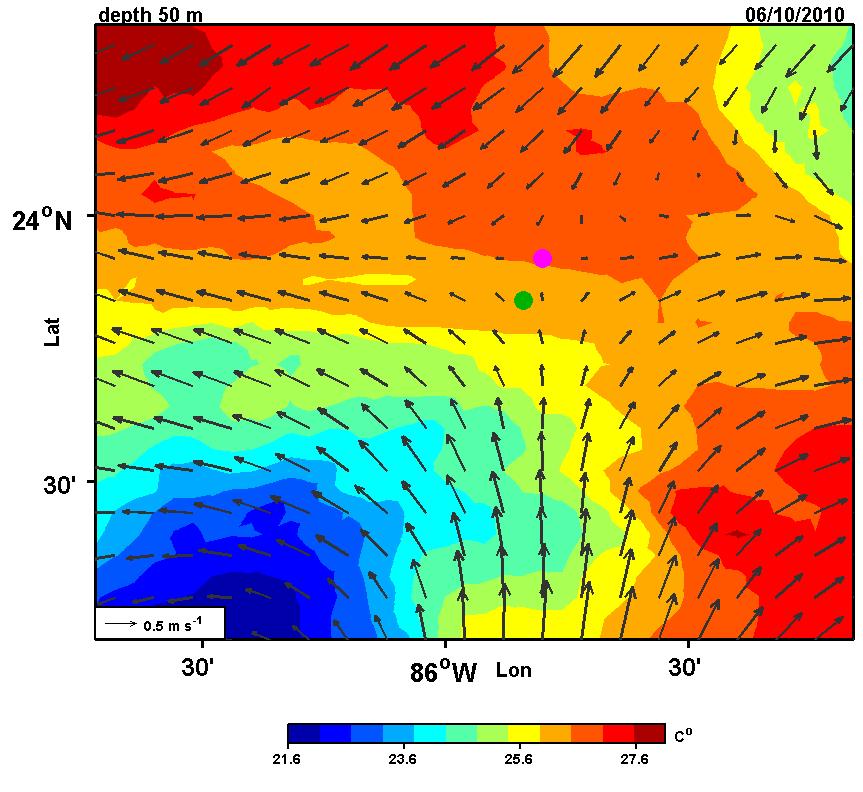
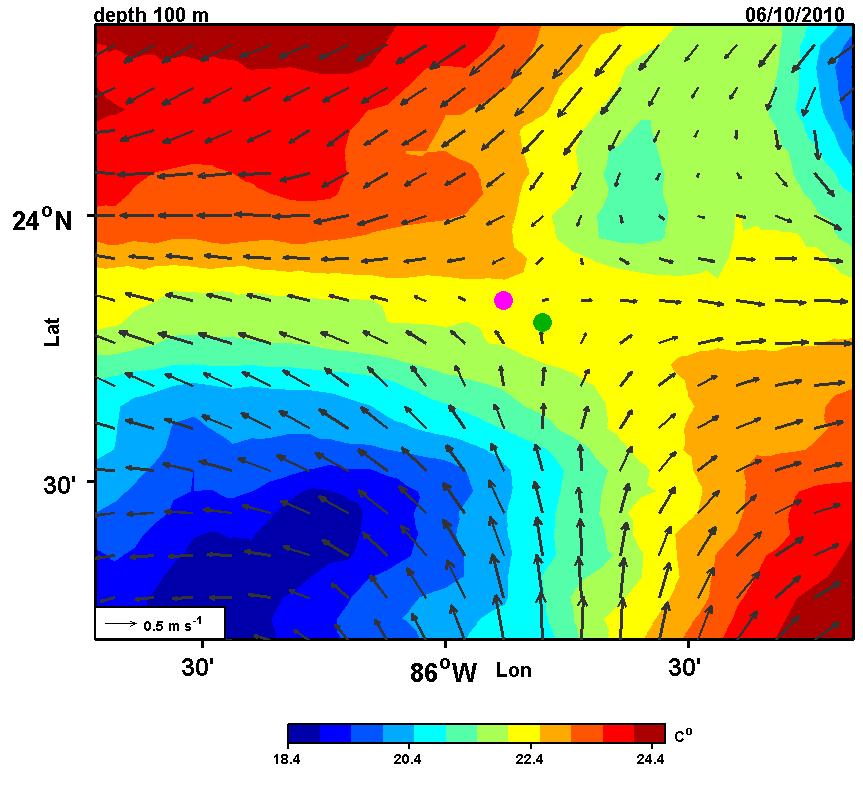
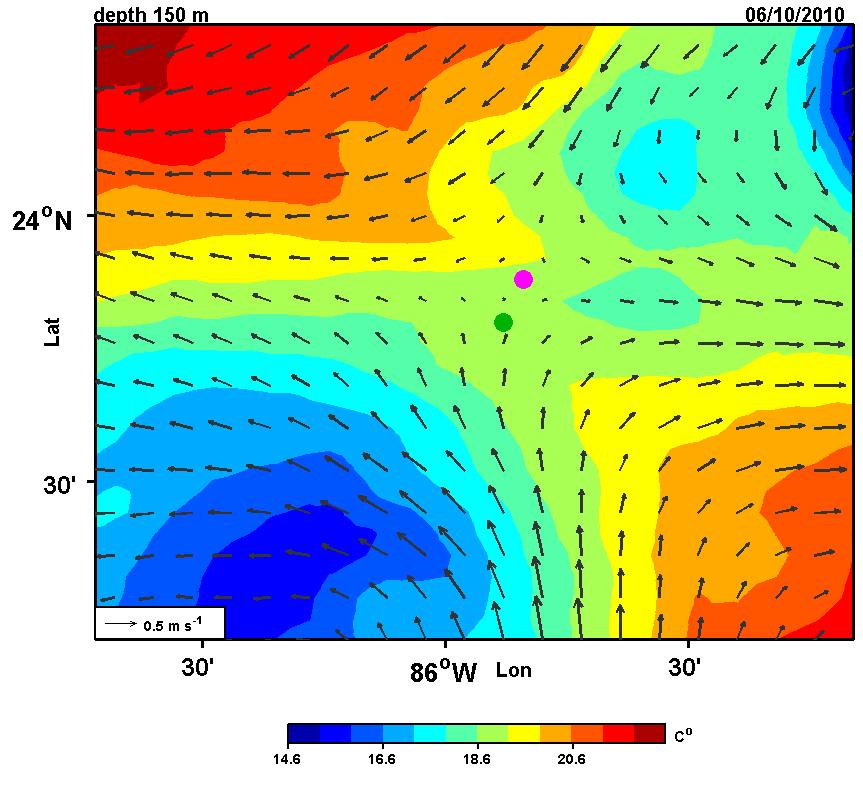
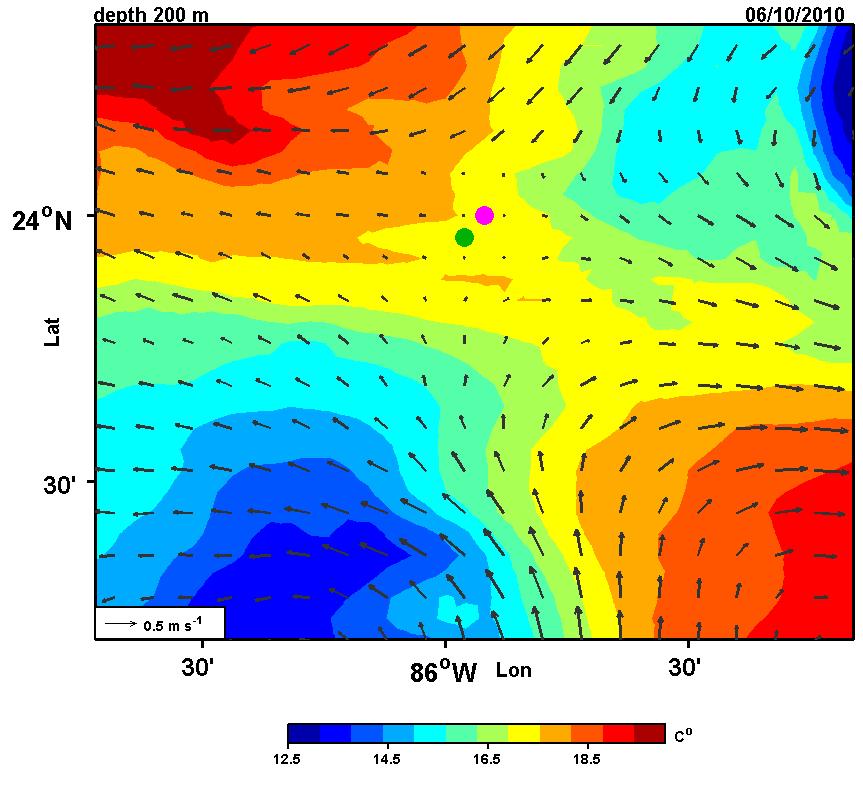
Contour Plots of the temperature field: Saddle points of the temperature field (green); Stagnation points of the velocity field
(magenta):
June 5, 2010:
June 10, 2010:
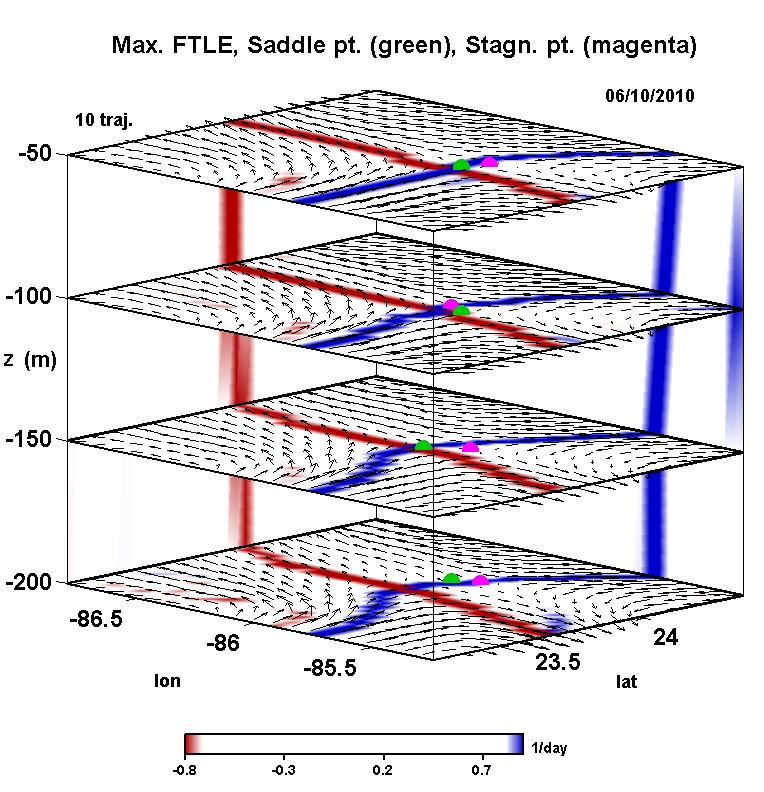
3D view of the max FTLE obtained from 10 days trajectories: Saddle points
of the temperature field (green); Stagnation points of the velocity field
(magenta).